CBD is one of the most popular cannabinoids – second only to delta-9 THC – and the most popular non-pscyhotropic one by a long stretch. It has been rising in popularity for many years now, enjoying something of a boom as a result of the 2018 Farm Bill making it legal at the federal level in the US (though illegal in a couple of States, see below). With all manner of CBD products available, including – but not limited to – tinctures, topicals, vape cartridges and liquids, gummies, concentrates and CBD flower. However, finding good information on how many people use CBD, how the industry is progressing, concerns consumers have and other facts can be challenging.
RELATED: Marijuana Statistics and Facts
CBD Statistics
We’ve collected these CBD statistics to help you find the key information you need on CBD, its users, the legal situation surrounding it, the market, other alternative cannabinoids and much more.
How Many People Use CBD?
Use of CBD in the US has been increasing over recent years, but based on data from 2020, around 18% of the population has ever tried CBD. This can also be broken down by frequency of use:
| At least once a day | 21% |
| Once to a few times a week | 19% |
| Once to a couple of times a month | 17% |
| A few times per year or less | 18% |
| Only tried once or twice | 25% |
Again, this frequency of use data was gathered in 2020, but there’s little reason to suspect a drastic change in this over time.
How Usage Breaks Down by Gender
The overall rate of use of CBD varies only slightly by gender:
- Men: 18%
- Women: 19%
Although the breakdown by frequency of use shows that women are slightly over-represented as infrequent users and men are over-represented as frequent users:
| Frequency | Men | Women |
|---|---|---|
| At least once a day | 23% | 19% |
| Once to a few times a week | 23% | 16% |
| Once to a couple of times a month | 17% | 17% |
| A few times per year or less | 18% | 18% |
| Only tried once or twice | 19% | 30% |
Here, the percentages are off all male/female CBD users. This basically shows that despite there being more female CBD users overall, these are more likely to be clustered towards less frequent use.
How Do CBD Users Break Down By Age
It probably won’t come as much of a surprise that CBD users skew a little young overall:
- 18 to 34: 23%
- 35 to 54: 21%
- 55 and older: 14%
You can see there’s a huge dip in usage for those aged 55 or older, with the younger age groups being roughly equal. However, when you look at frequency of use by age, it suggests that the older people who use CBD are much more likely to be doing so every day:
| Frequency | 18-34 | 35-54 | 55+ |
|---|---|---|---|
| At least once a day | 14% | 22% | 27% |
| Once to a few times a week | 17% | 20% | 19% |
| Once to a couple of times a month | 21% | 18% | 12% |
| A few times per year or less | 22% | 17% | 15% |
| Only tried once or twice | 26% | 23% | 26% |
Overall, this paints a picture of younger CBD users being more likely to use it infrequently, likely in a more casual way. However, even though older people are just as likely as the youngest to have tried it once or twice, they are much more likely to settle into daily use.
Awareness of CBD and Products
With a relatively large number of users and increasing acceptance of marijuana and related products, high awareness of CBD is expected at this point. And indeed the vast majority of Americans have heard of CBD:
- Have heard of CBD: 84%
- Haven’t heard of CBD: 10%
- Aren’t sure: 4%
In line with this, most people have also seen CBD products either in person or online:
- Seen products in person: 11%
- Seen products online: 23%
- Seen in both places: 46%
- Never seen products: 21%
Giving and Receiving Recommendations
One of the factors identified by New Frontier and others who’ve analyzed the CBD industry is the importance of recommendations when it comes to the use of CBD and interest in it. The statistics show that the vast majority of CBD consumers have been recommended CBD:
- Has someone recommended CBD to you in the past? (% Saying Yes)
- Consumers: 84%
- Non-Consumers: 28%
- All: 39%
And users are fairly likely to have recommended CBD to others too:
- Have you recommended CBD to others? (% Saying Yes)
- Consumers: 56%
- Non-Consumers: 7%
- All: 17%
The high proportion of CBD users who’ve been recommended CBD in the past and the fact that the majority go on to recommend it to others shows that social relationships and peer recommendations are a key part of the CBD market and its rise in popularity.
Why Do People Use CBD?
CBD has tons of potential uses, ranging from easing the symptoms of specific medical conditions to more general uses like easing anxiety or for general wellness. But what do the statistics say about why people use CBD?
When people were asked to choose their primary reason for using CBD, they responded:
- Medical: 9%
- Pain: 41%
- Unwinding: 33%
- General wellness: 18%
The overall results vary a little if people are allowed to choose more than one response. So the percentages here add up to more than 100% but they give a broader picture of why people use CBD:
- Medical: 23%
- Pain: 58%
- Unwinding: 60%
- General wellness: 48%
Notably, while pain is still a very popular reason for using CBD, when people can choose more than just a primary reason, it’s clear that unwinding is the most common explanation for CBD use. We’ll go into a bit more detail about this in a moment, but it makes sense that many people who use CBD for a specific purpose would also do so to unwind. So pain is the most likely specific reason for using CBD, but more general use for unwinding is more common.
Most of these entries aren’t especially specific, but the survey did find out more specific answers too. Of the people choosing “medical” from the above list, the breakdown is:
- Treating condition: 70%
- Gastrointestinal conditions: 14%
- Managing side effects: 11%
- Reducing spend on other medications: 5%
Of those choosing “unwinding,” the breakdown is:
- Anxiety: 56%
- Relaxation: 22%
- Stress reduction: 21%
For those choosing “general wellness,” they were specifically referring to:
- Overall wellness: 32%
- Falling asleep: 31%
- Sleep quality: 10%
- Mood: 5%
- Energy: 1%
- Fitness training: 1%
- Other: 18%
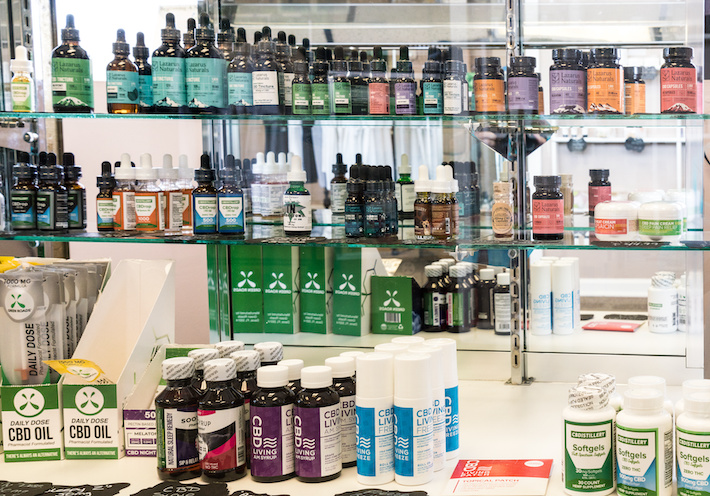
What Type of CBD Do Most People Use?
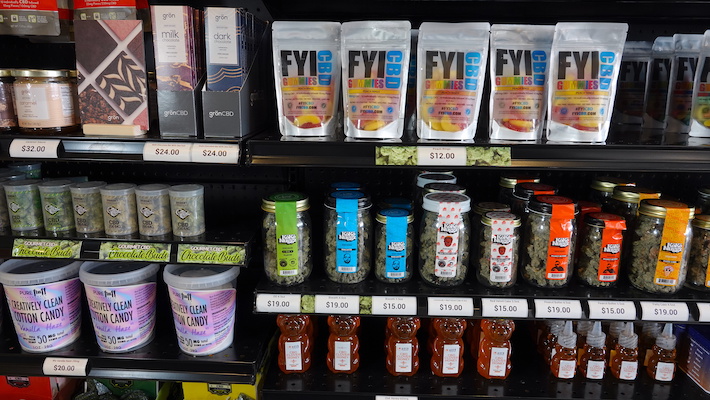
CBD comes in a variety of forms, and even though tinctures/oils are the most “traditional” form, it really doesn’t capture how people use CBD in 2021. The breakdown looks like this:
- Oils: 38%
- Topicals: 19%
- Food/drink: 18%
- Flower/vape pen: 15%
- Capsules: 7%
Although CBD oils are still the dominant form of CBD used, there is a lot of competition from topical balms and salves, food and drink products, flower and vaping in particular.
The types of CBD used also vary a little based on the reasons people have for using CBD. For medical users, the breakdown looks like this:
- Oils: 45%
- Topicals: 18%
- Food/drink: 11%
- Flower/vape pen: 9%
- Capsules: 14%
For people using CBD for pain, the breakdown is:
- Oils: 40%
- Topicals: 29%
- Food/drink: 11%
- Flower/vape pen: 11%
- Capsules: 6%
For people using CBD to unwind:
- Oils: 38%
- Topicals: 9%
- Food/drink: 24%
- Flower/vape pen: 21%
- Capsules: 5%
And finally, people using CBD for general wellness prefer:
- Oils: 32%
- Topicals: 13%
- Food/drink: 25%
- Flower/vape pen: 17%
- Capsules: 9%
There are many things to note here, but the most striking is that people using CBD for medical purposes choose capsules much more than other groups. This makes sense in that it feels more like “medicine” if you’re taking a pill, but a greater-than-average amount also choose oils. Additionally, people who are using CBD for pain are the most likely to use topicals by a substantial margin. And finally, vape pens or flower are most popular with people using CBD to unwind or for general wellness, being an uncommon choice for medical use.
How Much CBD Do People Use Per Day?
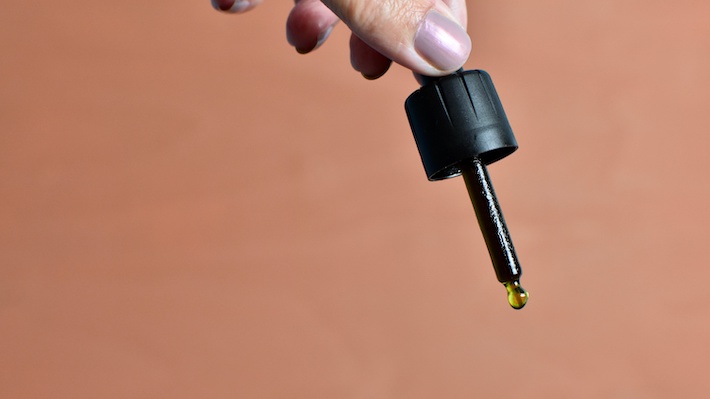
Dosages for CBD can vary quite wildly, depending on factors such as your reason for using it and your personal tolerance and preferences. However, using the statistics on CBD doses can help to cut through this variation and give a more overall picture of how much people use. The breakdown looks like this:
- Less than 10 mg: 17%
- 10 to 29 mg: 26%
- 30 to 49 mg: 12%
- 50 to 99 mg: 10%
- 100 mg +: 12%
This shows that the most common dosage range is between 10 and 29 mg, but really all doses under 30 mg are pretty common. This breakdown (from New Frontier) doesn’t add up to 100%, though, so assumedly the remaining 23% were unable to estimate their daily use, but this isn’t clear from the report.
What Side Effects Do CBD Users Experience?
Estimating how common side effects from using CBD are isn’t always the easiest thing to do, but this 2018 study recruited a (self-selected) sample of users online and asked about their CBD use, including side effects. This gives a good overall picture of the most likely side effects stemming from CBD use. Here are the overall statistics for all users:
- Dry mouth: 11.1%
- Euphoria: 6.4%
- Hunger: 6.4%
- Other: 2.4%
- Red eyes: 2.7%
- Sleepy/groggy: 1.8%
- Overall side effects: 30.8%
The last item here simply counts the proportion experiencing any side effects. Given that dry mouth, hunger and euphoria are the most common, this figure being high isn’t a sign that 31% of people using CBD will have a “negative” experience. It really just means they will experience something other than just the intended effect.
However, it’s useful to break this down a little further to cover different purposes for using CBD. For people using CBD for medical purposes, the side effect data looks like this:
- Dry mouth: 11.7%
- Euphoria: 4.0%
- Hunger: 5.4%
- Other: 3.1%
- Red eyes: 2.3%
- Sleepy/groggy: 2.0%
- Overall side effects: 28.5%
And for people using CBD more generally, the side effect data is:
- Dry mouth: 10.1%
- Euphoria: 10.4%
- Hunger: 7.9%
- Other: 1.2%
- Red eyes: 3.5%
- Sleepy/groggy: 1.5%
- Overall side effects: 34.6%
There are a few interesting differences here, but two in particular are worth emphasizing. Firstly, euphoria as a side effect is much more likely in people using CBD generally than for a medical purpose. This is potentially subjective – perhaps it’s a more standard effect of CBD people using non-medically a more likely to categorize that way, for instance – but comforting if you want to use medically. And secondly, overall side effects are higher for general users, which could also be subjective in the same way.
Consumers’ Views on CBD and Its Legal Status
While having a good understanding of who uses CBD is really useful and informative, what they – and society in general – think of CBD is crucial for understanding how things are likely to evolve in the future. With statistics available on both consumers’ and non-consumers’ views on CBD, misconceptions about the cannabinoid and more, these offer a useful window into people’s current understanding of CBD.
What Do People Think of CBD Overall?
Starting with a broad perspective, people’s overall views on CBD give a key insight into how people see the cannabinoid. Taking everybody together, the split between positive, negative and neutral views looks like this:
- Positive: 48%
- Negative: 17%
- Neutral: 35%
While less than half of people hold explicitly positive views of CBD, overall people are either ambivalent or positive about it, with only 17% holding a negative view. For consumers, the pattern shifts (predictably) towards positive views:
- Positive: 84%
- Negative: 3%
- Neutral: 13%
For non-consumers, their views are a lot more in line with the overall consensus:
- Positive: 39%
- Negative: 21%
- Neutral: 40%
Although it’s important to note that still only around 1 in 5 hold a negative view.
What Are People’s Views on Specific Aspects of CBD?
More fine-grained questions give a deeper insight into what people think about CBD and specific issues surrounding it. Again, the answers to these questions are slightly different depending on who you ask, with consumers being more likely to endorse positive views than non-consumers, overall. The differences aren’t huge for all of the questions here, so we’ve pointed out the differences where appropriate.
Here are the statements and the percentages agreeing with them:
- CBD should be required to be tested: 61%
- Consumers: 70%
- CBD has valid medical uses: 61%
- Consumers: 84%
- Regulated CBD is safer: 52%
- Consumers: 61%
- CBD should be freely available: 45%
- Consumers: 80%
- Non-Consumers: 37%
- There is not enough research on efficacy: 34%
- There is not enough research on safety: 33%
- CBD is best described as nutritional supplement: 24%
- Consumers: 37%
The biggest difference between consumers and non-consumers is regarding the availability of CBD, with 4 in 5 consumers supporting free availability, compared to less than 2 in 5 non-consumers. However, it’s interesting to note that consumers are more likely to support testing and regulation than the average respondent.
Do People Have Misconceptions About CBD?
A survey from SingleCare asked people about a few common misconceptions surrounding CBD, and generally showed that people have only a limited understanding and that many myths persist.
- 26% thought CBD was the same as marijuana
- 57% thought that CBD would show on a drug test
- 47% thought that the government regulates CBD
Of course, CBD is a non-psychoactive cannabinoid also contained within the marijuana plant, not the same thing, it will not show on a drug test and the government does indeed regulate CBD to some extent through the Farm Bill.
What Concerns Do Customers Have About CBD Products?
With the finding above that CBD consumers are more likely to support testing and regulation, there is much more insight in the specifics. When asked about several specific aspects of CBD, the proportion responding “somewhat” or “very concerning” was:
| Quality of products | 64% |
| Accurate dosing | 54% |
| Taste | 45% |
| Presence of contaminants | 42% |
| Legal status | 36% |
| Presence of THC | 32% |
It’s clear that most of the concern is around “getting what you pay for,” more so than more “government-level” type concerns such as whether there is too much THC. It’s also interesting that legal status isn’t much of a concern, although it’s fair to say this may be related to the fact it’s completely legal in the vast majority of states anyway.
Of course, quality and accurate dosing are very valid concerns, and it suggests that providing lab reports and conducting regular testing is the most important thing companies can do to build customer loyalty.
How Many States Restrict or Ban CBD?
Although the 2018 Farm Bill basically legalized CBD at the federal level provided there is less than 0.3% delta-9 THC, states are able to institute stricter rules if they chose to. Generally, most states don’t outright ban CBD, but there are exceptions, and many states don’t allow it in any situation.
Overall:
- Fully illegal: 3 states (Idaho, Iowa and South Dakota)
- No major restrictions: 18 states (Alabama, Florida, Hawaii, Illinois, Indiana, Missouri, New Hampshire, New Jersey, New Mexico, North Dakota, Ohio, Oklahoma, Oregon, Rhode Island, Tennessee, Texas, Virginia and Wyoming)
- Allowed, but not in food or beverages: 22 states (Alaska, Arizona, Arkansas, California, Colorado, Connecticut, Georgia, Kansas, Kentucky, Maryland, Massachusetts, Michigan, Minnesota, Montana, Nebraska, North Carolina, Pennsylvania, South Carolina, Vermont, Washington, West Virginia, Wisconsin)
- Other restrictions: 7 states (Delaware, Louisiana, Maine, Mississippi, Nevada, New York, Utah)
The most common restriction is that CBD can’t be sold as part of food or beverages in many states, and while labeling requirements weren’t considered restrictions for the purposes of this breakdown (they aren’t a major restriction) they were common. We also didn’t count limiting sales to over 18s as a major restriction, although this only came up as a specific issue in Missouri.
The “other restrictions” is a little vague, but generally they’re just a little stricter than others in varied ways.
- Delaware: the grower has to be linked to Delaware State University
- Louisiana: the retailers must first be registered with the Alcohol and Tobacco Control office
- Maine: CBD must be extracted from the plant of a licensed Maine hemp grower
- Mississippi: Must be at least a 20:1 CBD to THC ratio
- Nevada: Sale only allowed in cannabis stores, and no food or beverages
- New York: Requires purity testing in addition to banning CBD-infused food or beverages
- Utah: Registration required to sell CBD
CBD Market Size and Consumer Habits
The final group of statistics for this post are the ones related to consumer spending and the market overall. This gives some crucial information if you’re interested in CBD from a business perspective, and also gives a bit of a deeper insight into consumer behavior.
How Much Do Consumers Spend Per Month?
The average monthly spend for a consumer gives stores an idea of how much each customer will bring into their business, with some variation depending on characteristics such as age and gender. While you’ll need a lot more information to really estimate what each customer is worth to you as a business (for example, how loyal they’re likely to be), this gives a very useful starting-point.
Based on New Frontier data, the average monthly spend on CBD for consumers breaks down like this:
| Less than $20 | 22% |
| $20 to $49 | 23% |
| $50 to $99 | 16% |
| $100 to $149 | 8% |
| $150+ | 5% |
| Never purchased | 23% |
Note that the “never purchased” is largely down to CBD consumers who get CBD from friends or family. Based on the results, it’s clear that the vast majority of consumers spend less than $50 per month. However, this varies a little for men vs. women, for example. For men:
- Less than $20: 19%
- $20 to $49: 21%
- $50 to $99: 18%
- $100 to $149: 10%
- $150 + : 7%
- Never purchased: 21%
So although there are many similarities to the overall picture, it seems that men are slightly more likely to spend larger amounts than the average consumer, and this is especially obvious looking at the corresponding figures for women:
- Less than $20: 24%
- $20 to $49: 24%
- $50 to $99: 15%
- $100 to $149: 6%
- $150 + : 3%
- Never purchased: 25%
In contrast, it’s clear that the spend for women is much more concentrated around the lower end of the scale, with relatively fewer spending large amounts each month, and more never purchasing at all.
The average monthly spend also varies for customers of different ages, and as expected, it’s generally younger people that spend less money:
- Less than $50
- 18 to 24: 47%
- 25 to 34: 45%
- 35 to 44: 40%
- 45 to 54: 42%
- 55 to 64: 46%
- 65+: 54%
- $50+
- 18 to 24: 15%
- 25 to 34: 29%
- 35 to 44: 37%
- 45 to 54: 31%
- 55 to 64: 28%
- 65+: 28%
- Never purchased
- 18 to 24: 33%
- 25 to 34: 24%
- 35 to 44: 21%
- 45 to 54: 25%
- 55 to 64: 24%
- 65+: 15%
The most instructive thing to look at here is which group has the highest proportion for each spend. For example, over 65s are most likely to spend under $50 (closely followed by 18 to 24 year olds), 35 to 44 year olds are most likely to spend over $50, and 18 to 24 year olds are most likely to never purchase themselves.
How Does Average Monthly Spend Vary According to Purpose of Use?
The breakdown of purpose of use we’ve stuck with through this post – medical, pain, unwinding and general wellness – have some impact on the average monthly spend for consumers.
- Less than $50
- Medical: 40%
- Pain: 48%
- Unwinding: 41%
- General wellness: 50%
- $50+
- Medical: 40%
- Pain: 28%
- Unwinding: 29%
- General wellness: 24%
- Never purchase
- Medical: 18%
- Pain: 21%
- Unwinding: 28%
- General wellness: 20%
It’s clear from the above that while every group is basically clustered towards lower spends, people using CBD for medical purposes are much more likely to spend larger amounts, especially compared to people using for general wellness.
How Does Average Monthly Spend Vary According to Type of CBD Used?
While the results above show most of the variation in the monthly spend for consumers, there is also a breakdown available based on the type of CBD customers prefer to use. This can give a little more insight into how different consumer habits affect monthly spends.
- Less than $50
- Oil: 42%
- Topicals: 50%
- Edibles: 48%
- Flower or vape pens: 47%
- Capsules or other: 44%
- $50+
- Oil: 33%
- Topicals: 21%
- Edibles: 28%
- Flower or vape pens: 25%
- Capsules or other: 33%
- Never purchase
- Oil: 22%
- Topicals: 28%
- Edibles: 21%
- Flower or vape pens: 23%
- Capsules or other: 21%
While every subdivision tends to spend less than $50 per month, the people using oils, edibles or capsules in particular are likely to spend a bit more, with those using topicals in particular likely to spend substantially less.
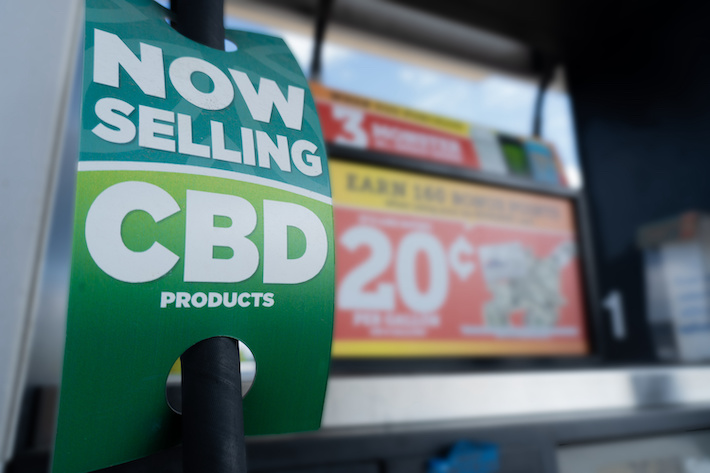
Where Do CBD Consumers Purchase From?
With so many options for customers looking to purchase CBD, the breakdown of how people shop is useful for understanding consumer behavior and the ways the market is likely to evolve in future. There are a couple of sources for data on this, with a 2019 Consumer Reports survey giving overall figures and a Brightfield Group report showing brick-and-mortar only purchasing habits for both 2020 and 2021.
The 2019 report gives this breakdown for CBD products:
- Dispensary: 40%
- Retail store: 34%
- Online: 27%
- Another source: 12%
It’s important to note that this data is a little bit out of date, and in particular the online proportion of these sales is likely to have increased since the survey was conducted. For example, the Brightfield Group report on Buying CBD During a Pandemic estimated that in both Q2 and Q3 2020, 47% of consumers bought CBD online. Their mid-year report for 2021 focuses on brick and mortar sources, and shows that for Q1 in 2020 and 2021, the breakdown is:
- Dispensary:
- 2020: 30%
- 2021: 32%
- CBD retailer:
- 2020: 26%
- 2021: 32%
- Smoke/vape shop:
- 2020: 27%
- 2021: 18%
- Natural food/vitamin store:
- 2020: 17%
- 2021: 19%
- Pharmacy:
- 2020: 8%
- 2021: 13%
- Gas station / convenience store:
- 2020: 9%
- 2021: 8%
Out of these options, dispensaries and CBD retailers were the most popular places to purchase in 2021, with increases in the proportions using each over the past year too. This suggests that more “specialized” stores are the preferred choice, aside from online purchases. In addition, it’s worth noting the big drop in smoke and vape shops as a place to buy, as well as an increase in the number using pharmacies.
How Much is the US CBD Industry Projected to Make In the Coming Years?
Arguably the most important statistic for the future of the market is the projected growth and the annual spend on CBD from consumers. The New Frontier CBD Consumer series report provides a run-down of the likely total spends (all expressed in billions) on CBD from 2020 through 2025:
| 2020 | $14.86 |
| 2021 | $16.67 |
| 2022 | $18.69 |
| 2023 | $20.96 |
| 2024 | $23.51 |
| 2025 | $26.37 |
This is the mid-range projection, but they also offer lower and higher bounds that can help put the predictions into context. For 2025, for instance, the minimum projection is $18.95 billion and the maximum is $34.48 billion.
The Brightfield Group’s mid-year report also offers projections for the pharmaceutical CBD industry up to 2026. Again, these projections are in billions of USD:
| 2019 | $0.22 |
| 2020 | $0.47 |
| 2021 | $0.66 |
| 2022 | $0.84 |
| 2023 | $1.01 |
| 2024 | $1.33 |
| 2025 | $1.75 |
| 2026 | $2.05 |
In short, there is expected to be massive growth in both the general and pharmaceutical-only CBD industry in the coming years. For general purchases, the total value is expected to increase 1.58-fold from now until 2025, and for pharmaceutical purchases, it is expected to increase 3.1-fold in revenue between now and 2026.
Who Are the Top 5 CBD Companies as of Q4 2020?
Although there are many, many CBD companies out there, a handful account for a larger proportion of purchases than most of the other, smaller outfits combined. The top five companies in the industry don’t really dominate as such – the maximum share of purchases is still quite small – but they do stand out above the competition at present. The top five, with corresponding market shares, looks like this:
- Charlotte’s Web: 3.6%
- Medterra: 1.7%
- cbdMD: 1.6%
- CBDfix: 1.5%
- CBDistillery: 1.2%
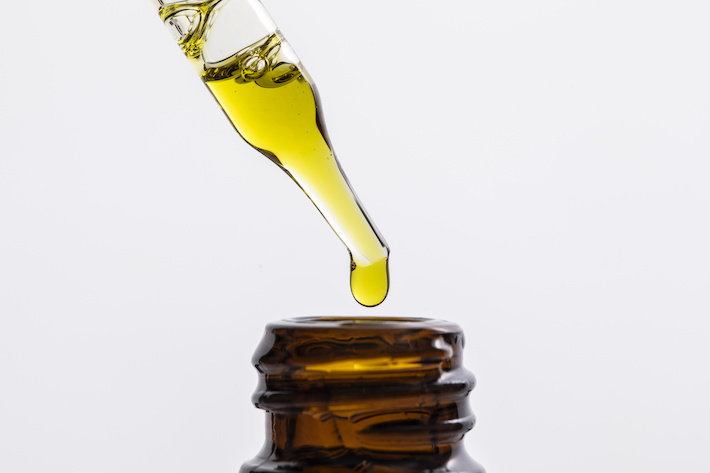
How Much Does CBD Cost Per mg?
The cost of CBD products has some pretty substantial variation, but if you break it down to the cost of CBD per mg of active ingredient, and focus on oils, you get a general picture of how much people are paying for the cannabinoid. Here are the prices (in USD) for a selection of the most popular companies on the market.
- Naternal: $0.03
- Medterra: $0.06
- cbdMD: $0.07
- CBDistillery: $0.08
- FAB CBD: $0.09
- Seabedee: $0.1
- Charlotte’s Web: $0.11
- Spruce: $0.12
- NuLeaf Naturals: $0.12
- Green Roads: $0.14
Overall, it’s clear that prices can vary quite widely, and also that the most popular companies are also not necessarily the most expensive. In fact, the market leader by a substantial amount is among the most expensive options, Charlotte’s Web, charging $0.11 per mg of CBD.
Delta-8 and Other Alternative Cannabinoid Statistics
CBD might be the most well-known cannabinoid aside from THC, but it definitely isn’t the only other chemical of interest in the cannabis plant. In particular, delta-8 THC has been making waves recently, and others like CBN, CBG and others have started to attract interest too. Delta-8 is the most widespread, though, and the best source of statistics on the general topic of alternative cannabinoids. With this whole section, though, it’s important to remember that the data is a little limited and there’s no guarantee of accuracy.
Do Men or Women Use Delta-8 More?
While it’s difficult to find hard figures for the number of people who use delta-8, the gender breakdown of delta-8 users can be established to some extent. According to a Brightfield Group report on delta-8, the gender breakdown of users is:
- Men: 47%
- Women: 53%
We also conducted a survey of people who’d heard of or used delta-8 in Texas, and the results suggest a slightly less even breakdown:
- Men: 57.6%
- Women: 42.4%
However, the results go in the opposite direction, so with just this to work with it’s probably safe to say that the breakdown is roughly even, possibly slanted in one way or another, but not by much.
How Old Are Delta-8 Users?
Our delta-8 survey collected a range of demographic information, including information about the age range of respondents. Looking just at those who’d at least tried delta-8 prior to the survey, the ages break down like this:
- 18 to 24: 14.5%
- 25 to 34: 31.5%
- 35 to 44: 39.1%
- 45 to 54: 10.9%
- Over 54: 4.0%
Although it’s swayed a little towards younger ages altogether, the biggest demographic is actually around late 20s to middle age. This is likely because of a mix of still being relatively young but having enough disposable income to try new things out.
The report from Brightfield Group also put the average age of delta-8 users at 34, which matches really closely with our results.
What is the Racial Breakdown of Delta-8 Users?
Our survey’s demographic information also included a look at the race of people who’ve used delta-8, although again this is only for Texas-based users. However, with few surveys and studies looking at delta-8 users, it’s one of the only sources of information on this topic out there. The breakdown from our survey looked like this:
- Asian: 1.8%
- Black: 14.1%
- Hispanic: 15.9%
- Latino: 1.1%
- Multiracial: 1.1%
- Other: 2.2%
- Prefer not to say: 2.2%
- White: 61.6%
Which Political Parties Do Delta-8 Users Support?
Our survey also asked about the political affiliation of people who use delta-8 in Texas. Again, this might not be totally representative of the country but there is little other information out there on this topic. So our survey suggests:
- Democrat: 46.7%
- Republican: 29.7%
- Independent: 23.6%
This shows a general shift towards democrats and independents compared to the state as a whole, in which 52% voted for Trump in 2020. This is about in line with what you’d expect for any measure of cannabis use compared to the general population.
Do Delta-8 Users Live in the City or Rural Neighborhoods?
According to research from the Brightfield Group, most delta-8 users live in rural neighborhoods:
- City: 42%
- Rural: 58%
There isn’t too much to add here, but it shows that having online delivery options is important if you want to reach most potential delta-8 customers.
How Many People are Aware of Delta-8?
Delta-8 is still a relative newcomer to the market, so awareness overall is much more limited than for something like THC. According to the Brightfield Group, 23% of CBD users have heard of delta-8. It’s very important to note that this is a percentage of American CBD users, not overall awareness in the population. Again, information is limited so this is as close as we can get for now.
How Do People Take Delta-8?
One of the few pieces of peer-reviewed research into delta-8 asked many questions about consumer experiences with the cannabinoid, including how people take it. They asked about the most common methods people used to take delta-8, and found the two most common responses were:
- Edibles: 64%
- Vaping concentrates: 48%
The fact that vaping appears higher than smoking on the list really reflects how new delta-8 is, but delta-8 is commonly found in vaping cartridges and edibles, so it does make some sense that this would be more common than smoking flower.
How Many People Use Delta-8 Medically, and Why?
According to the study cited above, around 51% of people who use delta-8 do so for medical purposes. Of these, the study also offers a breakdown in terms of the specific conditions they were using delta-8 to treat:
- Anxiety/panic attacks: 69%
- Stress: 52%
- Depression or bipolar: 46%
- Pain: 41%
There are some differences between the reasons people use delta-8 and CBD, which you’d expect given the different effects of the substances. It isn’t exactly the same as the breakdown for cannabis, but it is very similar with the exception of depression or bipolar appearing so high on the list.
Additionally, the study showed that 78% of users didn’t inform their doctor they were using delta-8, with 70% saying that they weren’t confident that their doctor could integrate their delta-8 use into their treatment.
What Do People Mention in Social Conversations About Delta-8?
The Brightfield Group report also included information about what people discuss in social conversations about delta-8, compared to similar conversations for CBD. The results showed that people discuss:
- Relaxation:
- Delta-8: 20%
- CBD: 9%
- Sustainability:
- Delta-8: 17%
- CBD: 19%
- Beauty and Skincare:
- Delta-8: 4%
- CBD: 14%
- Exercise:
- Delta-8: 5%
- CBD: 11%
Overall, the results paint a picture of delta-8 use being more for general recreational purposes, while CBD has more conversations surrounding more wellness and health related issues such as beauty and skincare or exercise.
Should Delta-8 Be Regulated as Part of the Hemp or Cannabis Market?
Lawmakers are currently grappling with the best way to regulate delta-8, with the most commonly-cited tracks being regulating it in a similar way to hemp or in a similar way to legal cannabis markets. HempGrower and the Cannabis Business Times conducted a survey of people in the cannabis and hemp industries to get an answer to this question.
Overall, the results broke down like this:
- Hemp Market:
- Yes: 51%
- No: 35%
- Don’t Know: 8%
- Under Certain Circumstances: 6%
- Cannabis Market:
- Yes: 59%
- No: 23%
- Don’t Know: 12%
- Under Certain Circumstances: 6%
Overall, despite similar results whether participants were asked about the hemp market or the cannabis market, there was a slight preference overall for regulating delta-8 as part of the cannabis market.
For people in the hemp industry, the breakdown of responses was:
- Hemp Market:
- Yes: 55%
- No: 34%
- Don’t Know: 7%
- Under Certain Circumstances: 4%
- Cannabis Market:
- Yes: 61%
- No: 25%
- Don’t Know: 10%
- Under Certain Circumstances: 4%
For people in the cannabis industry, the breakdown was:
- Hemp Market:
- Yes: 52%
- No: 41%
- Don’t Know: 3%
- Under Certain Circumstances: 4%
- Cannabis Market:
- Yes: 66%
- No: 18%
- Don’t Know: 8%
- Under Certain Circumstances: 8%
Overall, both groups still opted for the cannabis market overall, but people in the cannabis industry were most likely to say this. However, there is some confusion here because both groups also had more than 50% answer positively to delta-8 being regulated as part of the hemp market too.
What Regulations Would People Like to See on Delta-8?
The same survey also asked the respondents what regulations they would want to see on delta-8 if they had the choice. While the most common response was essentially “none,” there are some interesting specifics to be gleaned from the free responses given, after they were categorized:
- None: 59%
- Regulated like cannabis: 35%
- Quality and purity regulations: 32%
- Testing standards: 26%
- Age limit: 23%
- Labeling requirements: 18%
- Take off market: 13%
- Legalize all cannabis nationwide: 11%
- More research/education: 8%
- Dosage limits: 6%
There are many commonalities between the responses – for example, regulating like cannabis implicitly includes testing standards, age limits and more – but it’s good to know how many people support specific actions. While most people think that no further regulations are required, quality and purity regulations are the most widely-suggested specific action from people in relevant industries.
Conclusion
The statistics show that CBD is a popular product, and one that is continuing to grow in popularity, driven by both curiosity and regular use for relaxation or even specific medical purposes and with users across a wide range of ages. Customers do have some concerns about CBD products, and misconceptions persist in society, but people are generally positive towards the cannabinoid. While there is limited data for other cannabinoids, the reasons for their use and the things people recommend them for seem right in line with the data we have for THC and CBD. In future, we will certainly learn more about CBD, but more statistics on alternative cannabinoids are definitely needed.