
With legalized recreational cannabis becoming more common across the US and around the world, it’s never been more important to have accurate demographics of cannabis users. The good news is that with legal markets comes better data, and a widening of the market because you can just head to a dispensary rather than having to meet some sketchy dude on a street corner.
So if you’re running a store or you’re just looking for more insight into who uses cannabis, there has never been a better time to find the information you’re looking for. In some places, the demographics are in line with what you may expect, but there have been some notable shifts as cannabis moves into the mainstream.
Summary
- Millennials account for over half of cannabis bought in dispensaries, and Gen Z is rising quickly.
- Most sales breakdowns work out to around 60% men using cannabis, but the gender gap is closing.
- While American Indians or Alaska natives and black or African American people are most likely to use cannabis, the difference between them and white Americans is small and closing.
- People who completed some college or an associate’s degree are the most likely to use cannabis, followed by high school graduates.
- 29% of unemployed people smoke cannabis, compared to around one in five who are either part or full-time employed.
- People in metropolitan counties on the west coast are more likely to use cannabis than other regions and non-metropolitan counties.
- People who are poorer are more likely to use cannabis.
Cannabis Use By Generation
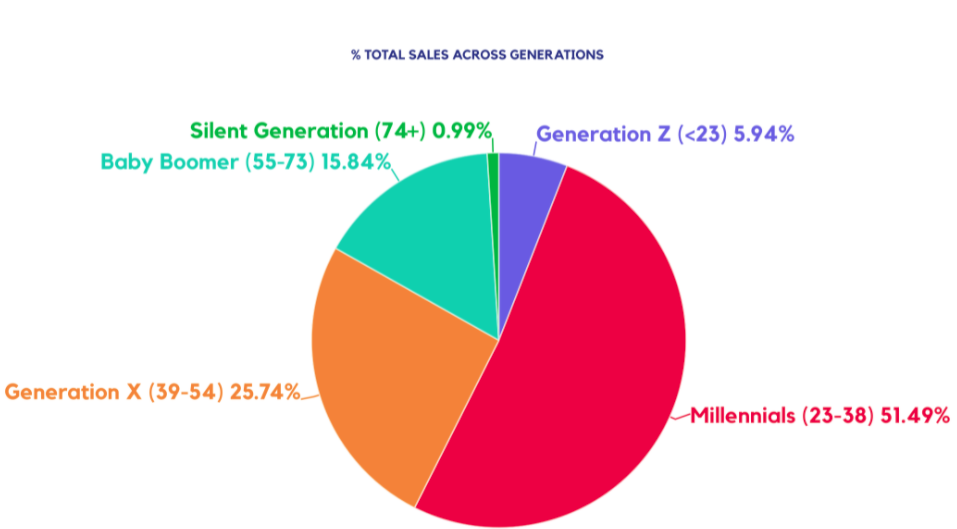
Data from Headset gives a detailed look at cannabis consumers by age, broken down into generational brackets. Overall, they found that the vast majority of sales – for the first half of 2019 in Washington – were to Millennials (classed as ages 23 to 38), who made up 51.5 % of all sales. The remaining generations bought less:
- Generation X (39 to 54): 25.7%
- Baby boomers (55 to 73): 15.8%
- Generation Z (>23): 5.9%
- Silent generation (74+): 1.0%
Headset does point out that while Gen Z currently only makes up a small proportion of the market, their share doubled from 2018 to 2019, and as more of them reach legal purchasing age, it’s likely to increase substantially. In fact, if the trend continues, they estimate that Millennials and Gen Z will dominate the market within a few years.
Flowhub also has statistics for 2020, and while Millennials still make up the bulk of purchases, based on their statistics, Gen Z accounts for 17%, only slightly under Gen X (at 21%) and higher than Boomers (13%). While this is based on over 1,000 dispensary locations from across the country, it broadly fits with the more specific Headset data and shows the continuing rise in Gen Z consumers.
Cannabis Use By Gender
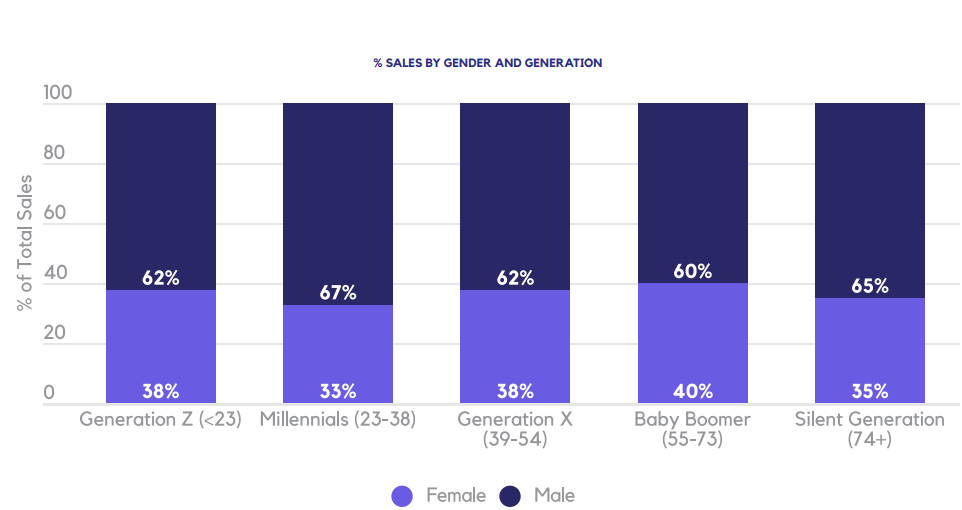
The Headset data shows a consistent difference – across generations – in gender when it comes to purchases. Broadly speaking, the breakdown is always 60% men or higher, but this varies with generation:
- Generation Z: 62% men / 38% women
- Millennials: 67% men / 33% women
- Generation X: 62% men / 38% women
- Baby Boomers: 60% men / 40% women
- Silent Generation: 65% men / 35% women
There are also gender differences if you look at the breakdown for specific products. For instance, for topicals, tinctures and sublinguals, the balance is 51% men to 49% women, while concentrates (70% men) and flower (67% men) skew male more heavily. Perhaps the most startling trend of this nature is that 8.3% of purchases by women include CBD, compared to 5% of men’s purchases. This is all broadly interpreted as women having a preference for “wellness-adjacent” products.
By Race
The National Survey on Drug Use and Health (NSDUH) collects data on race and other factors for marijuana users, and this gives the best insight we have into how cannabis users in the US breakdown by race. Based on the 2019 survey, for use in the previous year, single race participants and those aged 18 or over, the breakdown looks like this:
- American Indians or Alaska Natives: 20.4%
- Black or African American: 20.0%
- White: 18.9%
- Hispanic or Latino: 15.2%
- Native Hawaiian or Pacific Islander: 14.6%
- Asian: 7.9%
For people of two or more races, the rate is considerably higher at 30.5% using marijuana in the past year. The main change from 2018 was a decline in use by American Indians or Alaska Natives and Native Hawaiians or Pacific Islanders, with a smaller decrease for Asian people and increases for every other group. Broadly, aside from much lower rate for Asian people, racial differences in cannabis use appear to be shrinking over time, particularly among white and black Americans.
By Education Level
The NSDUH also collects data on the education level of the people who use marijuana, and while some parts may fly in the face of stereotypes, overall the differences are quite small. The breakdown looks like this, again for 2019 and use in the year preceding the survey:
- Some College/Associate’s Degree: 21.5%
- High School Graduate: 17.5%
- College Graduate: 15.8%
- Some High School: 15.7%
So overall, high school dropouts are the least likely to use marijuana, closely followed by college graduates. However, in comparison to the differences by race, generation and gender, the variation here is pretty small.
By Employment
The NSDUH also offers a breakdown of cannabis use based on current employment status, with the results corresponding a little more to what you may expect based on stereotyping (again for past year use in 2019):
- Unemployed: 29.3%
- Part time: 21%
- Full time: 19.9%
- Other (i.e. students, full time child care, retired, disabled e.t.c.): 12.6%
Aside from substantial increases from 2018 to 2019 for full-time employed and other employed people, these figures (and the order from most likely to least likely to use) haven’t notably changed.
By Region and County Type
The NSDUH also offers more geographical breakdowns of cannabis users, with geographical region and the type of area (e.g. metropolitan or non-metropolitan) being the two main factors considered. In both cases, we will again look at past year use in 2019 for people aged 18 or over. By geographical region the breakdown is:
- West: 22.3%
- Northeast: 18.6%
- Midwest: 17.3%
- South: 15.3%
And for the type of area:
- Large metropolitan: 19.2%
- Small metropolitan: 17.2%
- Non-metropolitan: 14.6%
So generally speaking, people living on the west coast and in large metropolitan counties are substantially more likely to use cannabis than those in other regions and types of community.
By Poverty Level
The NSDUH also offers a look at cannabis use by people in different financial situations relative to the poverty level, with groups of <100% of the poverty level (i.e. in poverty), 100 to 199% (above poverty line) and >200% of the poverty level (comfortable):
- In Poverty: 22.7%
- Above Poverty Line: 19.1%
- Comfortable: 16.7%
This shows that people with greater income are less likely to use marijuana, with the level of use increasing with family income.
RELATED: Most Important Statistics About Marijuana
Conclusion
The demographic breakdown of cannabis users shows a few things worth noting: generally cannabis users skew young, are more likely to be in metropolitan areas, on the west coast, unemployed and with some college or an associate degree, as well as male, low income and black or African American.
However, many of the traditional differences – especially those by race and gender – are becoming increasingly irrelevant as society moves towards legalization and steps continue to be taken to combat both race and gender biases. And it’s important to remember that while there are such (reasonably small) differences, most of these figures don’t take the relative size of the group in society, and many of them are liable to continue to change in the near future.
In a nutshell, you can certainly target your marketing to groups more likely to buy, but entirely ignoring any group isn’t especially wise.
RELATED: Key Statistics About CBD
Key References
- Center for Behavioral Health Statistics and Quality. (2020). 2019 National Survey on Drug Use and Health: Detailed tables. Rockville, MD: Substance Abuse and Mental Health Services Administration. https://www.samhsa.gov/data/report/2019-nsduh-detailed-tables
- Flowhub (2020) 2020 Cannabis Consumer Demographics. https://flowhub.com/cannabis-consumer-demographics
- Headset (2020) The demographics of cannabis consumers. https://www.headset.io/industry-reports/cannabis-demographic-analysis-trends
More About the Surveys
Although the statistics are the main focus of this post, some details about the data sources we’ve used can help give some much-needed context for the results. So here is a brief summary of each of the three main data sources.
National Survey on Drug Use and Health
The National Survey on Drug Use and Health (NSDUH) has been running periodically since 1971. The key points about the survey are:
- Survey of Americans aged 12 and over who are non-institutionalized and not in the military on active duty.
- Survey covers drug, alcohol and tobacco use as well as mental health issues.
- Survey is conducted in-person, but made anonymous, using audio-assisted self interviewing, with a response rate of around 46%.
- The sample size varies, but in 2019 it had over 67,500 respondents.
- The sample is nationally-representative.
There is a lot more information about the methodology here.
Headset Data
The data from Headset focuses more on the budding industry and its consumers, taking data from retail outlets.
- Data comes from Washington stores, which use analytics software provided by Headset.
- The consumers covered are those who have loyalty programs with the stores – not necessarily representative of everybody who goes in.
- The data was collected between January 1st and August 31st in 2019.
- The participants in the loyalty programs self-report the information, so there is a small chance for errors.
Flowhub
The data from Flowhub is similar to that from Headset, in that it comes from retail locations using the company’s retail management platform.
- The data comes from stores located across the country, with recreational states and medical-only ones represented: Colorado, California, Oregon, Nevada, Michigan, Alaska, Maryland and Montana.
- There are over 1,000 dispensaries in total as part of the dataset.
- The results come from 2020.
- The data includes generational breakdowns for each of the states.